The Weekly Close
After a pretty quiet week, Bitcoin closed its weekly candle just under $77k. This means that Bitcoin was able to close above our $76k range high and maintain its breakout. The real test will be whether Bitcoin will be able to maintain above it again this week. We are in no man’s land between $80.5k and $76k so instead of trying to predict the future, I’d rather let Bitcoin tell us whether the bulls or bears are in control. Weekly closes above $80.5k means bulls are in control and we are likely headed to the 50W MA. Weekly closes below $76k means bears are taking back control and we are likely headed back to $68k. Anything in between is just chop to wreck traders on both sides.

The Bitcoin Weekly Chart.
Market Sentiment
Market sentiment remains in fear. Investors are very concerned that the classic sell in May and go away pattern will play out for Bitcoin once again. We know the summer can be a rough time period for Bitcoin and other risk assets so it is important to be careful over the next few months given the fact that we are still in a bear market. Bitcoin likely needs some time to consolidate after this most recent relief rally so patience will be crucial over the next few weeks.

The CoinMarketCap Crypto Fear and Greed Index.
The Global Liquidity Index
The GLI is still consolidating at the highs which is promising given the fact that the GLI usually trends down in mid-term years. However, The GLI is pointing towards some Bitcoin consolidation over the next few months and Bitcoin seems to be following that path. The GLI is calling for a Bitcoin local bottom around mid-June, but I believe The GLI is best used as a general trend indicator and not an exact tool for predicting every Bitcoin bottom and top. The GLI is aligning with Bitcoin summer seasonality so it further increases the likelihood of a choppy summer.

Bitcoin and The Global Liquidity Index.
Inflation
We will be receiving an update to the FED’s preferred measure of inflation, Core PCE, on Friday, May 29th. The market will be watching this print very closely to see if skyrocketing energy prices are carrying over into overall inflation. This print will likely also impact the US Dollar and The GLI as a result. The market is expecting a slight increase in the YoY number from 3.2% to 3.3% so anything higher than that will likely spook risk assets. We want to see that print come in-line or below expectations.

The US Dollar Index.
The Bigger Picture
Bitcoin remains in the cheap 🟢 region. The 50W moving average is very close to entering the cheap 🟢 region so we likely won’t enter fair value 🟡 until Bitcoin re-enters a bull market. I’d love an opportunity to take some profits in the fair value 🟡 region in the near future, but given everything we already talked about in this report, it’s likely that Bitcoin spends more time consolidating in the cheap 🟢 region or even briefly enters the very cheap 🔵 region before making its move back to new highs. Regardless, we can’t go wrong having a system that allows us to successfully navigate all potential outcomes so I feel well prepared for whatever Bitcoin has in store.

Bitcoin’s value based on how extended price is from its 200-week moving average.
What I’m doing with my portfolio
I sold my Solana and trimmed my Ethereum position this morning. I have been considering this change for the past few weeks and this feels like the perfect opportunity to do so. Both assets look horrendous on their Bitcoin pairs and I want to increase my dry powder for better buying opportunities later in the year. If those better buying opportunities aren’t granted, I’ll happily buy higher once we have more confirmation that the bull market is back on.

Portfolio snapshot as of May 26th, 2026.
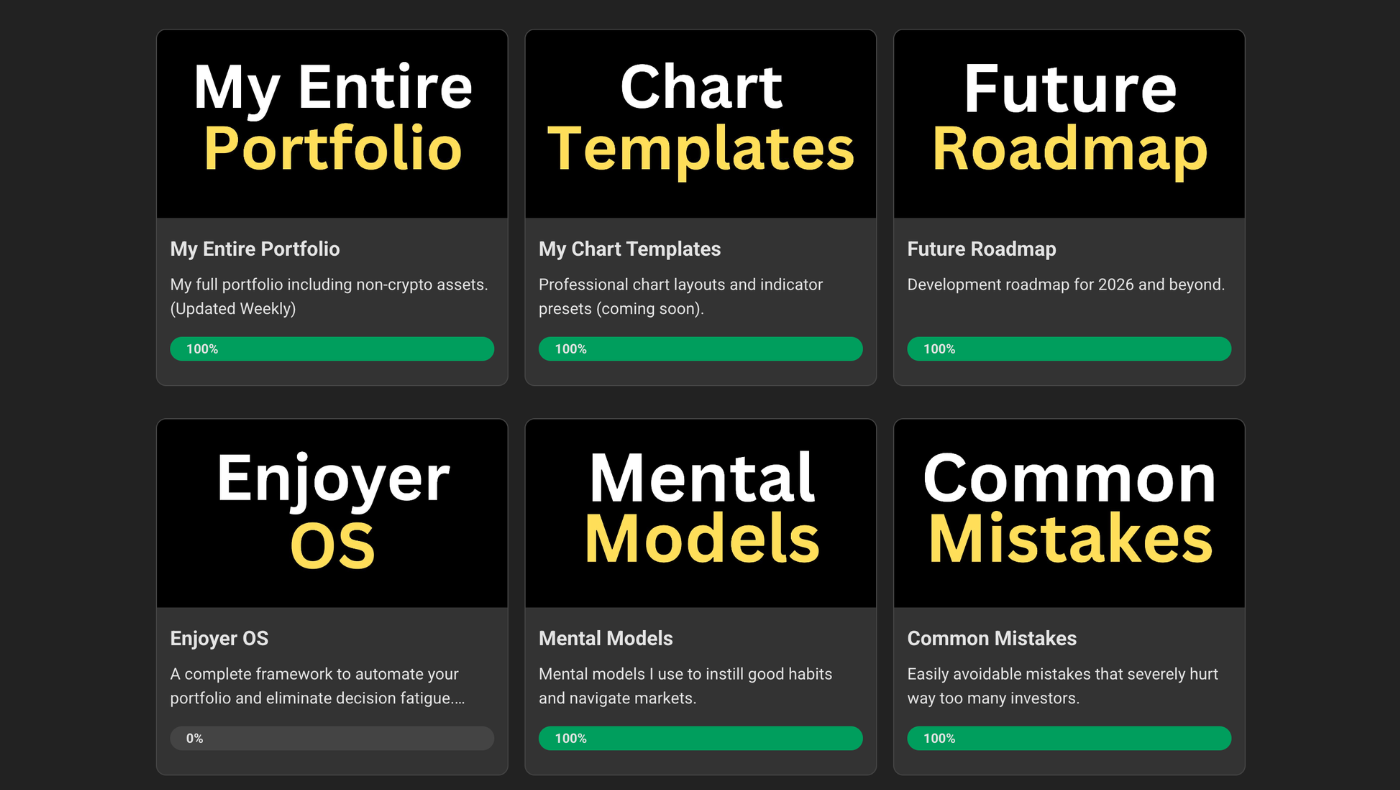
P.S. If you made it to the end of this report, thank you for reading and I hope you got some value from it. If you liked this report, you’ll love the Market Enjoyers program and community. You can learn more about it here:
I hope you have an amazing week and the future looks bright. 🤝