The Weekly Close
After a violent selloff that wicked below the 200W MA and our $60k February low, Bitcoin closed its weekly candle back above both at ~$63k. We now have a False Breakdown below that $60k range low which is usually a strong sign that bulls have shown up at these prices. All we need now is another weekly close above the 200W MA to confirm the false breakdown and we can then start to get more optimistic with upside.

The Bitcoin Weekly Chart.
Market Sentiment
Market sentiment has entered Extreme Fear. This is exactly what we want to see alongside the 200W MA test mentioned in the section above. Extremes in sentiment don’t always mean price will reverse immediately, but they are a strong signal that market participants are acting out of emotion and not logic. Extreme Fear is my ideal backdrop when buying an asset just like Extreme Greed is my ideal backdrop when selling one.

The CoinMarketCap Crypto Fear and Greed Index.
The Global Liquidity Index
The GLI has been doing an incredible job at providing warning signs for Bitcoin’s future price action over the past few months. It perfectly timed the bottom in February and now recently perfectly timed the top in May. I’m not sure if this perfect timing pattern will continue, but it is calling for a Bitcoin bottom in mid-June. This timing falls right in-line with what we are seeing in terms of sentiment and price action so it gives me even more conviction to accumulate at these prices.

Bitcoin and The Global Liquidity Index.
Inflation
We will be receiving an update to the FED’s preferred measure of CPI, Core CPI, on Wednesday, June 10th. This is an especially important print because market participants are very interested in the impacts of the oil shock on inflation. The market is expecting the YoY reading to increase from 2.8% to 2.9% so that outcome is already priced in. We want to see the print come in below or at those expectation so that markets don’t panic.

Core CPI.
The Bigger Picture
Bitcoin finally entered the Very Cheap 🔵 region last week. This is the first time Bitcoin has gone below the 200W MA in over 3 years so I see it as a major accumulation opportunity. I’m not sure exactly where Bitcoin will bottom, but what I do know is that no one who has every bought Bitcoin at or under the 200W MA has regretted that decision a year later. Maybe this time is different, but I’m not willing to bet that it is when this great of an opportunity presents itself.

Bitcoin’s value based on how extended price is from its 200-week moving average.
What I’m doing with my portfolio
I bought some Bitcoin this morning with the cash I raised from selling Solana and Ethereum a few weeks ago. Timing does not always play out this perfectly, but when it does, it is a pretty great feeling. I also rotated my remaining Ethereum into Strategy and Strive. I see them as better risk-adjusted assets than Ethereum at this point in time. I’m not sure where exactly Bitcoin will bottom, but I have a feeling I’ll be happy with these prices looking back a few years from now.

Portfolio snapshot as of June 8th, 2026.
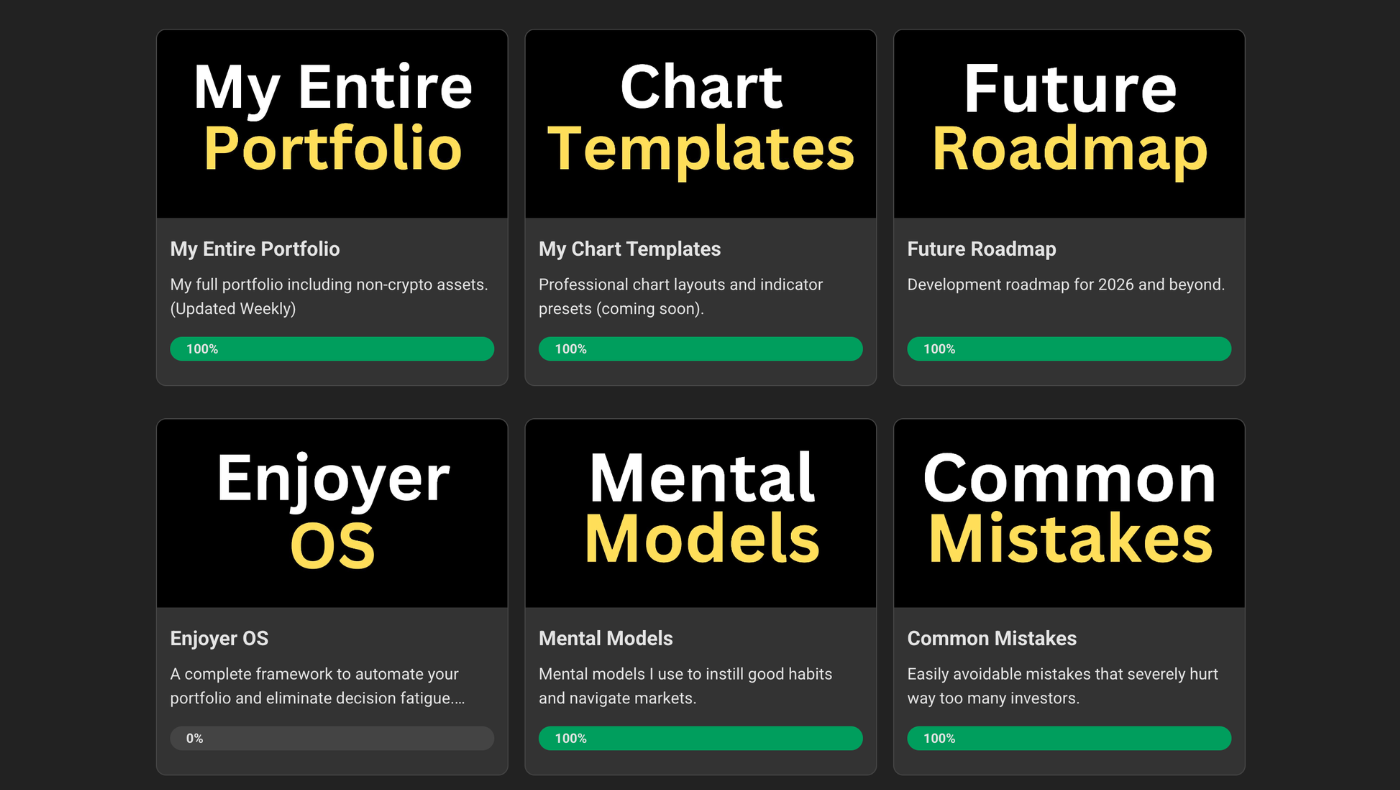
P.S. If you made it to the end of this report, thank you for reading and I hope you got some value from it. If you liked this report, you’ll love the Market Enjoyers program and community. You can learn more about it here:
I hope you have an amazing week and the future looks bright. 🤝