Weekly Close
After one of the worst capitulation events in its history, Bitcoin bounced just over $10,000 and closed back above our pivotal $69k level. It seems as though buyers finally found a price area where they couldn’t resist buying. Now we want to see more closes above that level to confirm a local bottom. Wicking below that level is fine, but we should not be closing below it if we want to see a strong rally here.

The Bitcoin Weekly Chart.
Market Sentiment
Market sentiment remains extremely fearful. Single digits on the Fear and Greed Index is quite rare and usually results in a decent sized relief rally at a minimum. Many investors were convinced that there was no chance Bitcoin was in a bear market and this capitulation in both price and sentiment represents their acceptance of that fact. Buying during periods of Extreme Fear usually works out well for investors with patience and a long time horizon.

The CoinMarketCap Crypto Fear and Greed Index.
The Global Liquidity Index
The GLI is hinting at a sizable Bitcoin rally over the next 2 months or so. It has done a great job predicting Bitcoin trend shifts in the past, but no indicator is perfect so we can’t rely on it alone to make decisions. It is great to see that The GLI’s timing aligned nearly perfectly with the biggest capitulation event since the Luna collapse in 2022. Now we just want to see Bitcoin show more strength and start to head higher from here.

Bitcoin and The Global Liquidity Index.
Inflation
We will be receiving an update to CPI and Core CPI on Friday, February 13th. The market is expecting CPI to drop from 2.7% YoY to 2.5% YoY. The market is also expecting Core CPI to drop from 2.6% YoY to 2.5% YoY. This would be great for rate cut expectations and the general investor belief that inflation continues to cool. We really don’t want to see CPI remain flat or increase on this print as that would spook markets.

Core CPI.
The Bigger Picture
Bitcoin continues to follow our base case for now. The capitulation event went lower than expected, but that doesn’t really matter for investors who aren’t gambling with leverage. What really matters is the weekly closes and strong signs of demand below $70k. That is what we have seen so far. It’s hard to know what the rest of 2026 will look like based on current price action, but many data points are lining up and pointing to a multi-week relief rally from these prices.

Bitcoin Cycle Scenarios.
What I’m doing with my portfolio
I bought some Bitcoin this morning. The confluence between a historic capitulation event, GLI pointing to a rally, price in the Cheap region and single-digit Extreme Fear is really hard to ignore. I know Bitcoin has a high likelihood of going lower in 2026 and I will save dry powder incase it happens, but I also don’t want to assume that it must happen like everyone else is right now. I am okay with not perfectly timing the bottom as long as I end up with a solid average entry that I will be happy with in the long-term. I’ll leave the stress of timing the bottom perfectly and going all-in there to everyone else.

Portfolio snapshot as of February 9th, 2026.
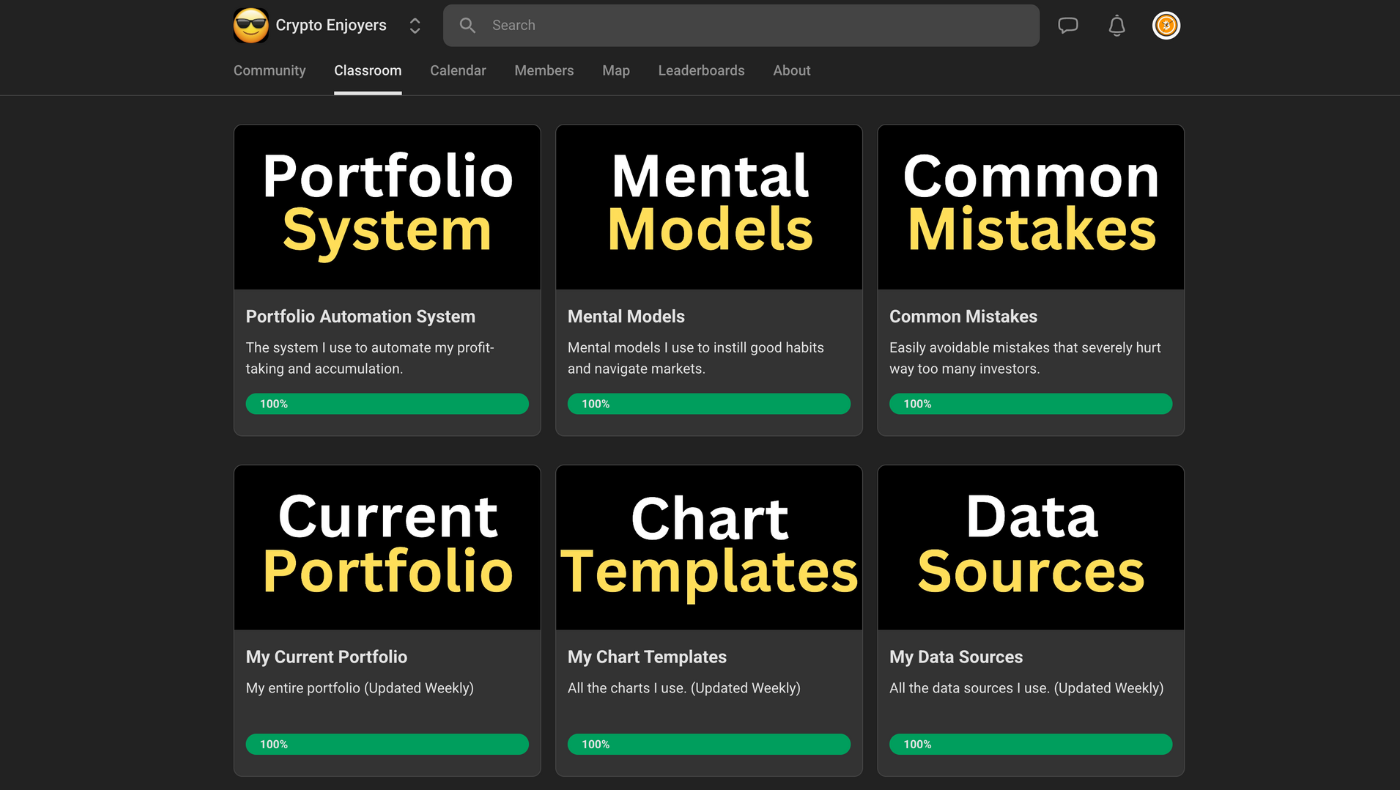
P.S. If you made it to the end of this report, thank you for reading and I hope you got some value from it. If you’d like to view my exact portfolio changes each week, my traditional markets portfolio and/or would like to learn more about my Portfolio Automation System, checkout the Crypto Enjoyers program and community. You can learn more about it here:
I hope you have an amazing week and the future looks bright. 🤝